GFMC: Forest Fires in the United States
Forest Fires in the United State
26 March 2002
Wildland Fire Update
The National Interagency Fire Center (NIFC) based in Boise (Idaho) provides key information on current wildland fire situations, related information and background materials. The following information is updated daily and can be accessed directly:
- State-by-State daily and year-to-date summary of fire activities
http://www.nifc.gov/fireinfo/nfn.html
- Year-to-date State-by-State total number of wildland fires and area burned (table)
http://www.nifc.gov/fireinfo/nfnmap.html
- Daily locations of large fires (map)
http://www.nifc.gov/fireinfo/firemap.html
The National Interagency Coordination Center (NICC) provides daily situation reports. These reports include:
- Incident Management Situation Reports (fires and area burned reported to NICC). The files include current, previous and archived reports
- Prescribed Fire and Wildland Fire Use (year-to-date fires and area burned reported to NICC, posted weekly on Monday mornings)
http://www.nifc.gov/news/RXWFUYTD.htm
Fire Weather & Fire Danger Information
The Wildland Fire Assessment System (WFAS) is a contribution of “The Fire Behavior Research Work Unit”, Missoula (Montana USA). The broad area component of the Wildland Fire Assessment System (WFAS) generates maps of selected fire weather and fire danger components.
Fire Danger (Potential) is a normalized adjective rating class across different fuel models and station locations. It is based on information provided by local station managers about the primary fuel model, fire danger index selected to reflect staffing level, and climatological class breakpoints. Low danger (Class 1) is green and extreme potential (Class 5) is red.


Fire danger maps for the United States for 25March 2002 (observation time) and 26 March 2002 (forecast)
(Source: WAFS)
Dead fuel moisture responds solely to ambient environmental conditions and is critical in determining fire potential. Dead fuel moistures are classed by timelag.


10-HR Fuel Moisture
100-HR Fuel Moisture
1000-HR Fuel Moisture
Fuel moisture maps for conterminous US, 25 March 2002
(Source: WAFS)
The Keetch-Byram Drought Index (KBDI) is a soil/duff drought index. Factors in the index are maximum daily temperature, daily precipitation, antecedent precipitation, and annual precipitation. The index ranges from 0 (no drought) to 800 (extreme drought) (details).

Keetch-Byram Drought Index Maps for conterminous US, 25 March 2002
(Source: WAFS)
Wildfire in New Mexico
RUIDOSO, N.MDropping winds and coolertemperatures helped firefighters contain five New Mexico wildfires Monday,including a blaze that destroyed 28 homes in a mountain neighborhood over theweekend. Winds more than 50 mph had pushed flames through subdivisions of mixedvacation and year-round homes near Ruidoso, N.M., about 190 miles southeast ofAlbuquerque. But the 800-acre Kokopelli fire was 60 percent contained Monday,said Tom Gorman, information officer for the state emergency operation.
A cold front with winds in the 10-15 mph range helped slowflames as fire crews using bulldozers cleared away brush and trees to createfirebreaks ahead of the blaze. “The high humidity and cooler temperatures(have) really helped what they’re trying to do, which is shut these firesdown,” Gorman said. As many as 1,300 people were evacuated over theweekend, and many were back on the scene Monday, picking through ashes andblackened foundations, all that remained of homes priced as much as $250,000.”Of the homes destroyed, 50 percent (of owners) were from out of state,mostly Texas,” Gorman said. Officials revised down an earlier report thatas many as 36 homes were destroyed. Damage is estimated at $5.2 million, Gormansaid. The blaze was believed to have been caused accidentally when a residentdumped hot ashes in his backyard. Four other fires continued to burn in thearea, the largest which started on the Mescalero Apache Indian reservation andso far burned up 16,000 acres, causing the evacuation of nearly 100 homes. Onevacant home was destroyed. New Mexico Gov. Gary Johnson signed a state emergencydeclaration making the Ruidoso area eligible for aid. (Source: ENN News, 26 March 2002)

NESDIS/OSEI NOAA-12 POES AVHRR LAC satellite images,
Heat signatures (red) and smoke plumes (light blue haze) are visible from fires burning in southern New Mexico. The Kokopelli fire (indicated by the white arrow), which
scorched more than 800 acres and destroyed 28 homes, forced the evacuation of about 1,300 people on Saturday. Another fire east of Ruidoso, N.M. charred about 12,000
acres and briefly forced a small number of residents of adjacent canyons to abandon their homes. This information is from a CNN report on 03/25/2002. The pink areas
visible in this image are due to solar heating of the ground surface.
(23 March 2002)
(Source: OSEI/NOAA)
Operational Significant Event Imagery (OSEI)
The following significant events were identified by Satellite Analysis Branch meteorologists and reviewed by the OSEI support team of the National Oceanic and Atmospheric Administration (NOAA):

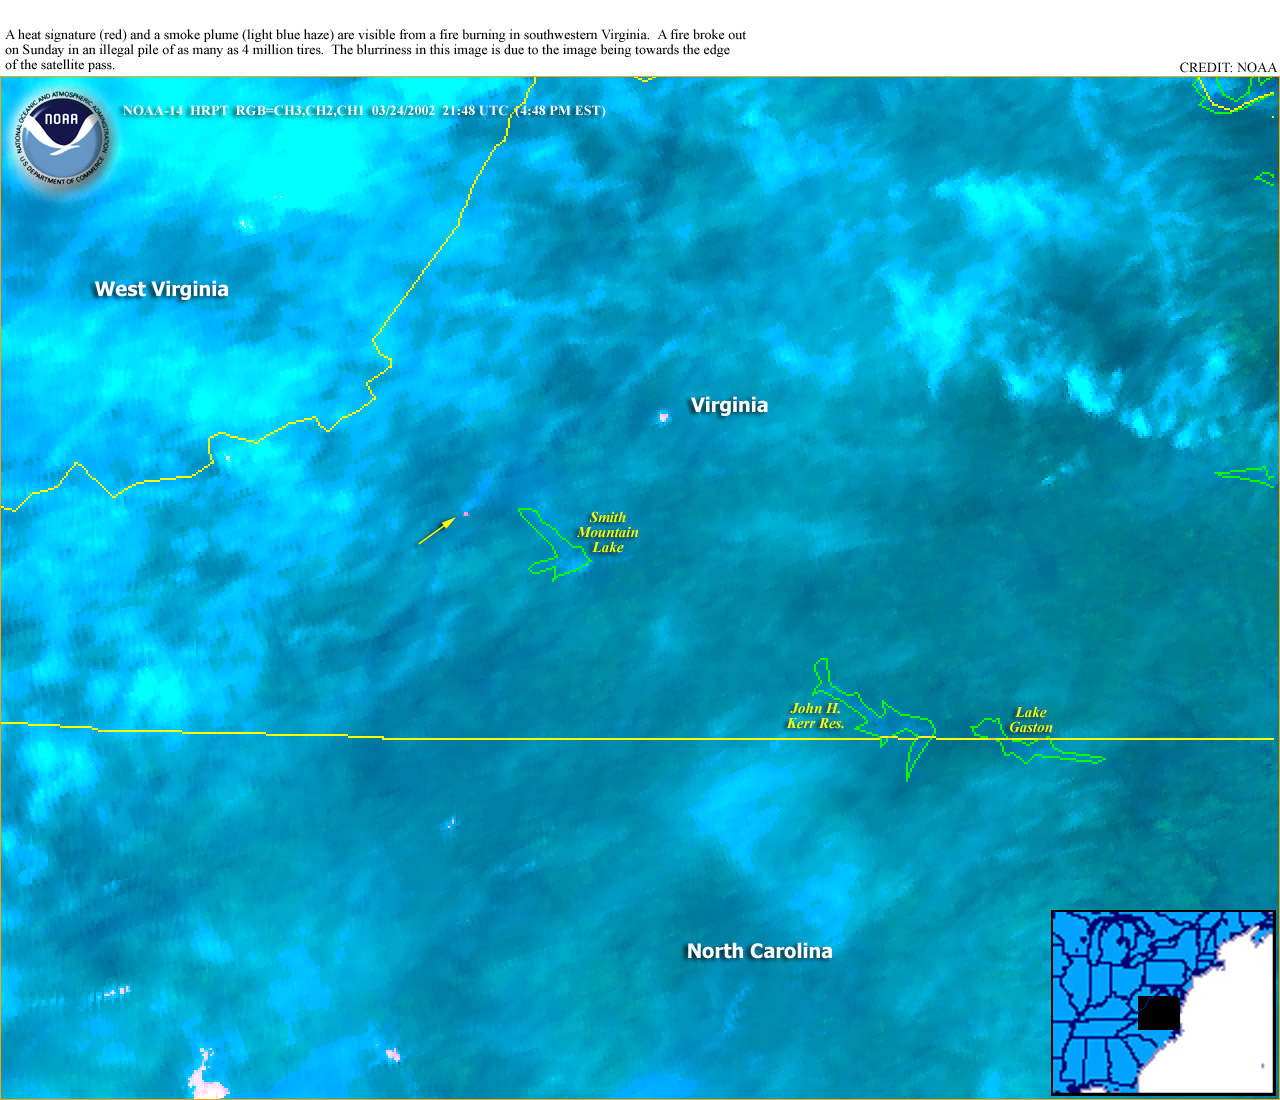
NESDIS/OSEI NOAA-14 POES AVHRR LAC satellite images,
Left: Heat signatures (red) and smoke (light blue haze) is visible from fires burning in California. (22 March 2002)
Right: A heat signature (red) and a smoke plume (light blue haze) are visible from a fire burning in southwestern Virginia. A fire broke out on Sunday in an illegal pile of as many as 4 million tires. The blurriness in this image is due to the image being towards the edge of the satellite pass.
(24 March 2002)
(Source: OSEI/NOAA)
For more information on the recent fire situation see: Recent Media Highlights on Fire, Policies, and Politics ,especially several articles since 1 November 2001.
Long-range weather forecasts
National Weather Service
Long-range, 30-day weather forecasts are predicting above-normal temperatures for the southern tier of states from southern California to Florida and throughout the Midwest (see 30 and 90-day forecast maps).

30 and 90-day temperature and precipitation forecast maps (February2002 and February to April 2002)
(Source: National Weather Service)
The Florida Division of Forestry gives the following long-range Wildfire Season Forecast September – March 2002 for Florida:
“A return to near normal conditions in the equatorial Pacific Ocean marks the end of the prolonged La Niña event that brought very active fire seasons to the state the past few years. Normal to slightly warmer sea surface temperatures in the Pacific will bring us our first normal winter in a while, and if sea surface temperatures continue to slowly warm we may get above normal rainfall this winter.”
For further information see: Wildfire Season Forecast of the Florida Division of Forestry
For further information you may also see to the U.S. Drought Monitor.
For background information on the Southern Area see the Edited Version of the Southern Area Intelligence Briefing Paper for 22 April 2001.
